


Weather and climate conditions have a significant impact on crop productivity and gross harvest.
Climate indicators can be provided individually or in blocks.
In addition to standard climatic indicators, a number of derived (assimilated or calculated) indicators and groups of indicators are widely used for a detailed assessment of climatic conditions, such as:
1. Bioclimatic indicators: dry matter productivity, leaf area index of high and low vegetation, length of the growing season, biologically effective degree days, maximum number of rain-free days.
2. Soil indicators: topsoil moisture, volumetric soil moisture.
3. Humidity indicators: dew point temperature.
4. Temperature derivatives: cooling duration index, warmth duration index, simple daily precipitation index, average daily temperature range, heat stress.
5. Solar radiation indicators: total direct solar radiation on the surface, photosynthetic active radiation, solar radiation flux.
6. Derived precipitation indicators: precipitation flux, liquid precipitation fraction, solid precipitation fraction.
|
Bioclimatic indicators |
Dry matter productivity |
Dry matter productivity (DMP) represents the overall growth rate or increase in dry biomass of vegetation and is directly related to net primary productivity (NPP), but with units adjusted for agro-statistical purposes (kg/ha/day). |
|
Leaf Area Index for high or low canopy |
In practice, LAI quantifies the capacity of vegetation cover. This parameter helps to understand the density of green cover. It also helps to understand the level of photosynthetic activity of the plant and the evaporation of water from the leaves. |
|
|
Duration of vegetation period |
The number of days between the first occurrence after 1 January (1 July in the southern hemisphere) of at least 6 consecutive days with TG > 5°C and the first occurrence after 1 July (1 January in the southern hemisphere) of at least 6 consecutive days with TG < 5°C, where TG is the daily mean temperature. |
|
|
Biologically effective degree days |
Biologically effective degree days are based on the accumulation of increasing degree days (based on 10°C) from April to October, adjusted for the rate of temperature increase, day length and range of daily temperatures. |
|
|
The maximum number of consecutive dry days |
The maximum number of consecutive dry days over a period of time with daily precipitation of less than 1 mm. |
|
|
Soil indicators |
Humidity of the surface soil layer |
Liquid water content in the surface soil layer at a depth of 2 to 5 cm, expressed as a percentage of total saturation. |
|
volumetric soil moisture content |
The liquid water content in the surface soil layer at a depth of 2 to 5 cm is expressed in m3 of water per m3 of soil. |
|
|
Humidity indicators |
Dew point temperature |
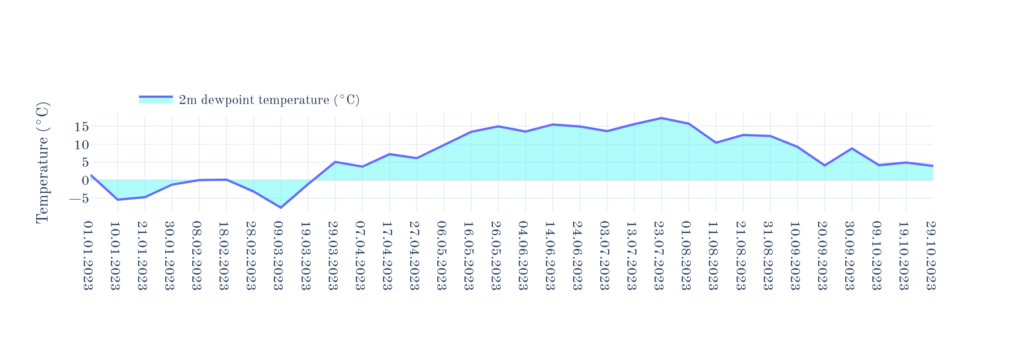
The dew point temperature is the temperature to which air must be cooled for saturation to occur. It is a measure of air humidity. In combination with temperature and pressure, it can be used to calculate relative humidity. In other words, this parameter is a characteristic of air humidity. |
|
Temperature derivatives |
cold spell duration index |
Number of days in the season with at least 6 consecutive days when TN < TN 10th, where TN is the minimum daily temperature and TN 10th is the 10th percentile of the calendar day. |
|
Heat duration index |
Number of days in the season with at least 6 consecutive days when TX > TX 90th, where TX is the maximum daily temperature and TX 90th is the 90th percentile of the calendar day. |
|
|
Simple daily precipitation intensity index |
The average RR value for 10 days with RR > 1 mm (wet days), where RR is the daily precipitation. |
|
|
Heat stress |
The number of days with maximum temperatures above a given threshold temperature during a given period of the year. Heat stress on crops can lead to reduced yields and deterioration in quality (e.g. fruit). This indicator can be used to highlight the impact of extreme events on crops. |
|
|
Solar radiation derivatives |
total amount of direct solar radiation on the surface |
The amount of direct radiation from the Sun that reaches the surface in a plane perpendicular to the direction of the Sun. |
|
photosynthetic active radiation |
is the part of the sun’s radiant energy that plants absorb through photosynthesis. |
|
|
Solar radiation flux |
The total amount of energy provided by solar radiation on a surface during the period 00-24 hours local time per unit area and time. |
|
|
Precipitation derivative indicators |
Liquid precipitation fraction |
The number of hours of precipitation between 00 and 24 hours local time divided by 24 hours per unit area. Liquid precipitation is equivalent to the height of the layer of water that would form from precipitation if the water did not infiltrate the soil, run off or evaporate. |
|
Solid precipitation fraction |
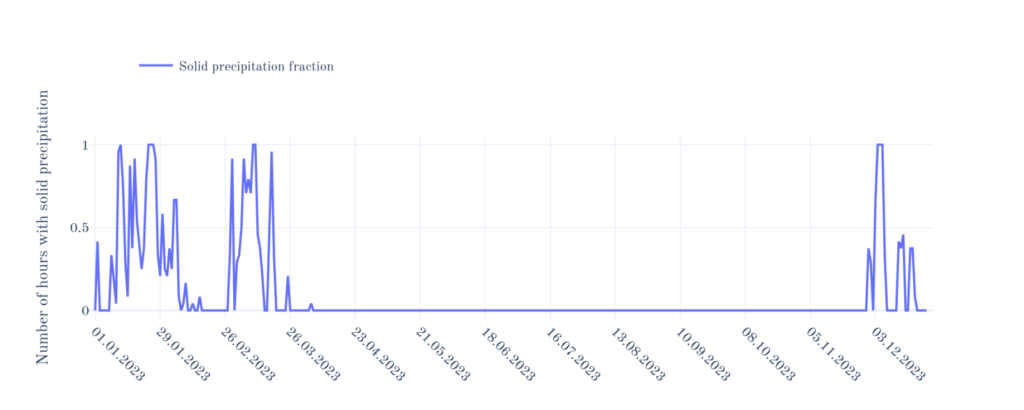
The number of hours with solid precipitation (freezing rain, snow, sleet, rain/snow mix, and ice pellets) during the period 00-24 hours local time, divided by 24 hours and per unit area. |

Example of data visualization

Full list of agroclimatic data available
|
Soil temperature |
|
Surface solar radiation downwards (SSRD) |
|
Surface solar radiation (SSR) |
|
Top net short-wave (solar) radiation, clear sky |
|
2m dew point temperature |
|
Leaf area index |
|
Total totals index |
|
Biologically Effective Degree Days |
|
Cold spell duration index |
|
Frost days |
|
Growing season length |
|
Maximum number of consecutive dry days |
|
Maximum number of consecutive frost days |
|
Maximum number of consecutive summer days |
|
Maximum number of consecutive wet days |
|
Maximum of daily maximum temperature |
|
Maximum of daily minimum temperature |
|
Simple daily intensity index |
|
Warm and wet days |
|
Warm spell duration index |
|
Wet days |
|
Surface soil moisture |
|
Volumetric soil moisture |